

Why Did Crypto Liquidations Surge as Bitcoin Fell Below $88,000?
Crypto liquidations surged after Bitcoin dropped below $88,000, triggering $381 million in leveraged position liquidations and wiping out $136 billion from the total crypto market cap in one session. The move was driven by excessive leverage and heightened market volatility, according to data from CoinGlass and CoinMarketCap.
What Caused the Spike in Crypto Liquidations?
The primary cause was Bitcoin breaking below a key support level, which forced automatic liquidations of over-leveraged long positions.
Key contributing factors:
- High leverage across BTC and ETH futures
- Thin liquidity during volatile trading hours
- Algorithmic liquidations accelerating sell pressure
When Bitcoin slipped below $88K, liquidation engines closed positions rapidly, intensifying the decline.
How Did Bitcoin and Ethereum Perform?
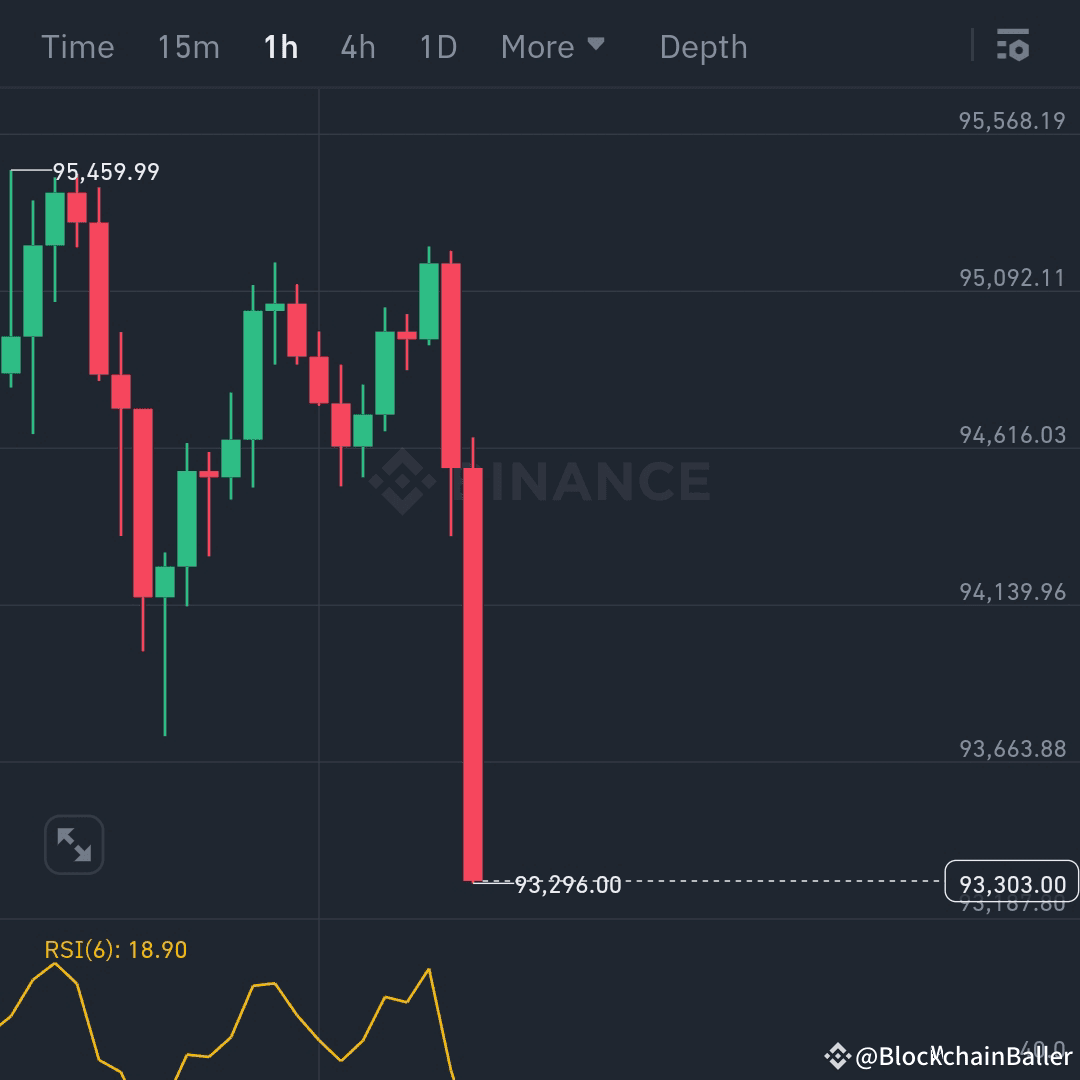
Bitcoin (BTC)
- Fell below $88,000
- Triggered the majority of the $381M liquidation volume
- Led overall market sentiment lower
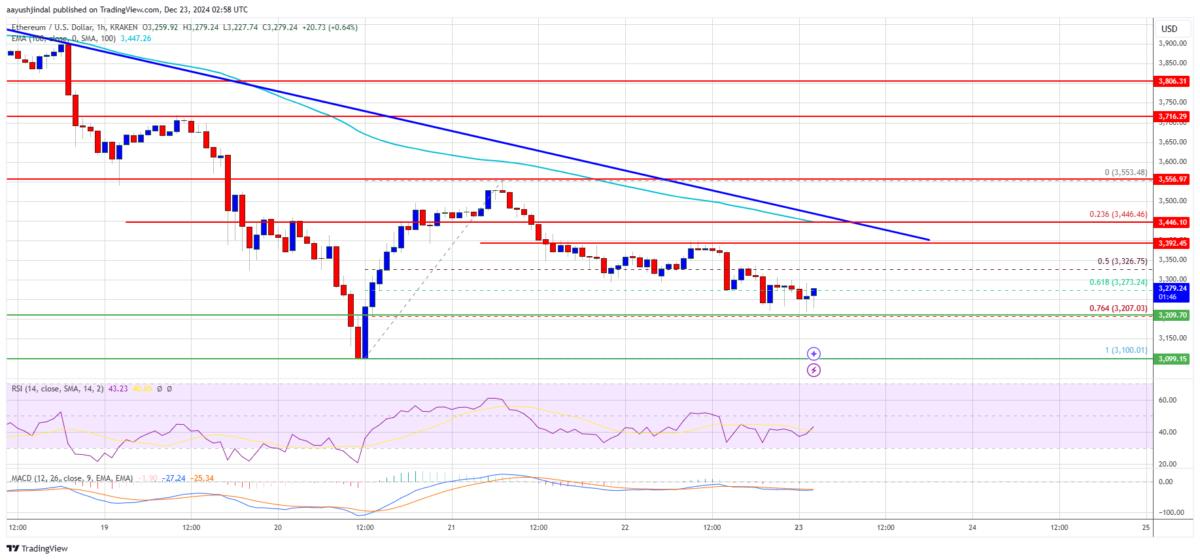
Ethereum (ETH)
- Dropped over 6%
- Experienced secondary liquidations as BTC weakness spread
- Underperformed due to higher leverage ratios in ETH derivatives
According to CoinGlass, Ethereum liquidations increased sharply once Bitcoin lost support.
What Happened to the Total Crypto Market Cap?
The total crypto market capitalization fell to $2.93 trillion, placing it between two major technical levels:
- Resistance: $3.2 trillion
- Support: $2.85 trillion
This range indicates market indecision, with traders reducing risk exposure rather than entering new positions.
Why Is Crypto More Volatile Than Traditional Markets?
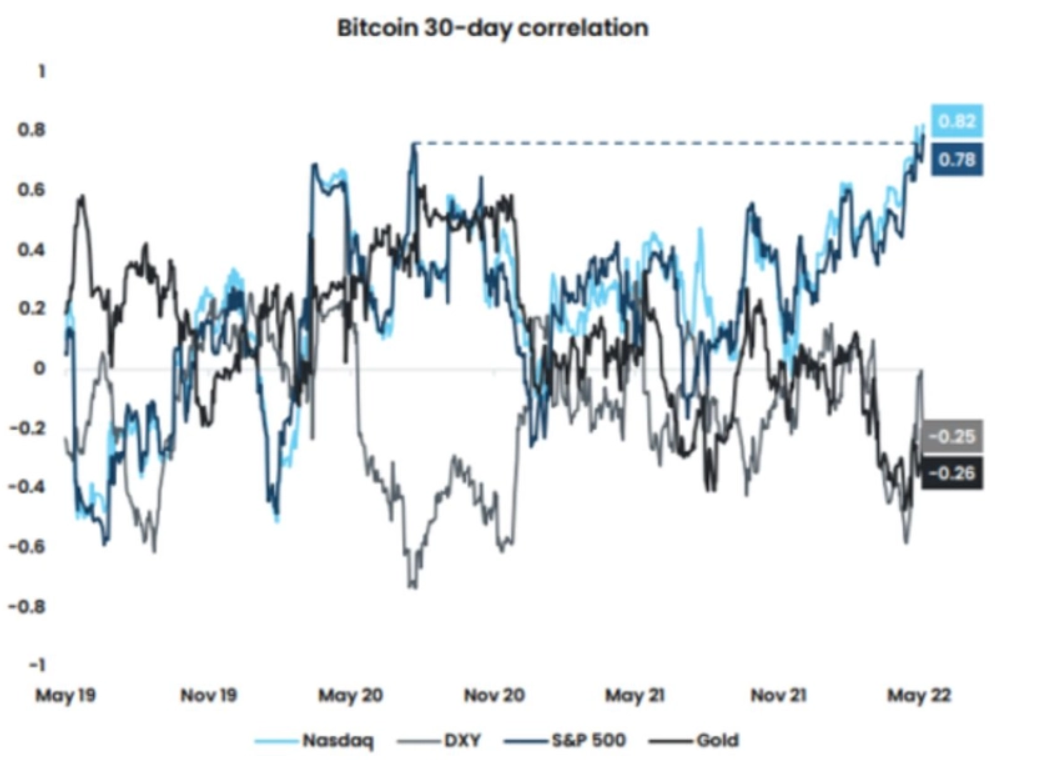
Crypto markets use higher leverage and operate 24/7, making price swings faster and more severe than equities.
For comparison:
- The S&P 500 posted only a mild decline during the same session (source: Bloomberg)
- Crypto lost $136B in market value in hours
This highlights how leverage amplifies downside risk during sudden price moves.
What Does This Mean for Traders and Investors?
- Short-term traders should expect continued volatility
- High leverage increases liquidation risk
- Long-term investors may view leverage flush-outs as market resets
Historically, large liquidation events often reduce excess leverage and stabilize markets in the following sessions.
Key Takeaways
- $381M in crypto liquidations occurred after BTC fell below $88K
- Total crypto market cap dropped by $136B
- Ethereum declined over 6% amid spillover selling
- Market remains range-bound between $3.2T resistance and $2.85T support
Frequently Asked Questions
What are crypto liquidations?
Crypto liquidations occur when leveraged trading positions are automatically closed because traders cannot meet margin requirements. This typically happens during sharp price movements and high volatility.
Why did liquidations spike when Bitcoin fell below $88,000?
Liquidations surged because Bitcoin broke a key support level, triggering automatic closures of over-leveraged long positions. According to CoinGlass, approximately $381 million in crypto positions were liquidated in a single session.
How did Ethereum react to the market downturn?
Ethereum fell more than 6% as selling pressure spread from Bitcoin. ETH experienced increased liquidations due to its high usage in leveraged derivatives trading, according to CoinGlass data.
How much did the total crypto market lose?
The total crypto market capitalization declined by approximately $136 billion, falling to around $2.93 trillion, based on figures from CoinMarketCap.
Why is crypto more volatile than the stock market?
Crypto markets use higher leverage, trade 24/7, and have lower liquidity than traditional markets. As a result, price movements are faster and more extreme compared to indices like the S&P 500, which showed only a mild decline (source: Bloomberg).
Is high leverage risky in crypto trading?
Yes. High leverage amplifies both gains and losses. During volatile periods, even small price moves can trigger large-scale liquidations, increasing downside risk.
What does this liquidation event mean for the market?
Large liquidation events often flush excess leverage from the market. Historically, this can reduce short-term risk and help stabilize prices, though volatility may persist in the near term.
What key levels should traders watch next?
Market participants are closely watching:
Resistance: $3.2 trillion total market cap
Support: $2.85 trillion total market cap
A break of either level could signal the next major market move.